Home Dashboard
Home Dashboard
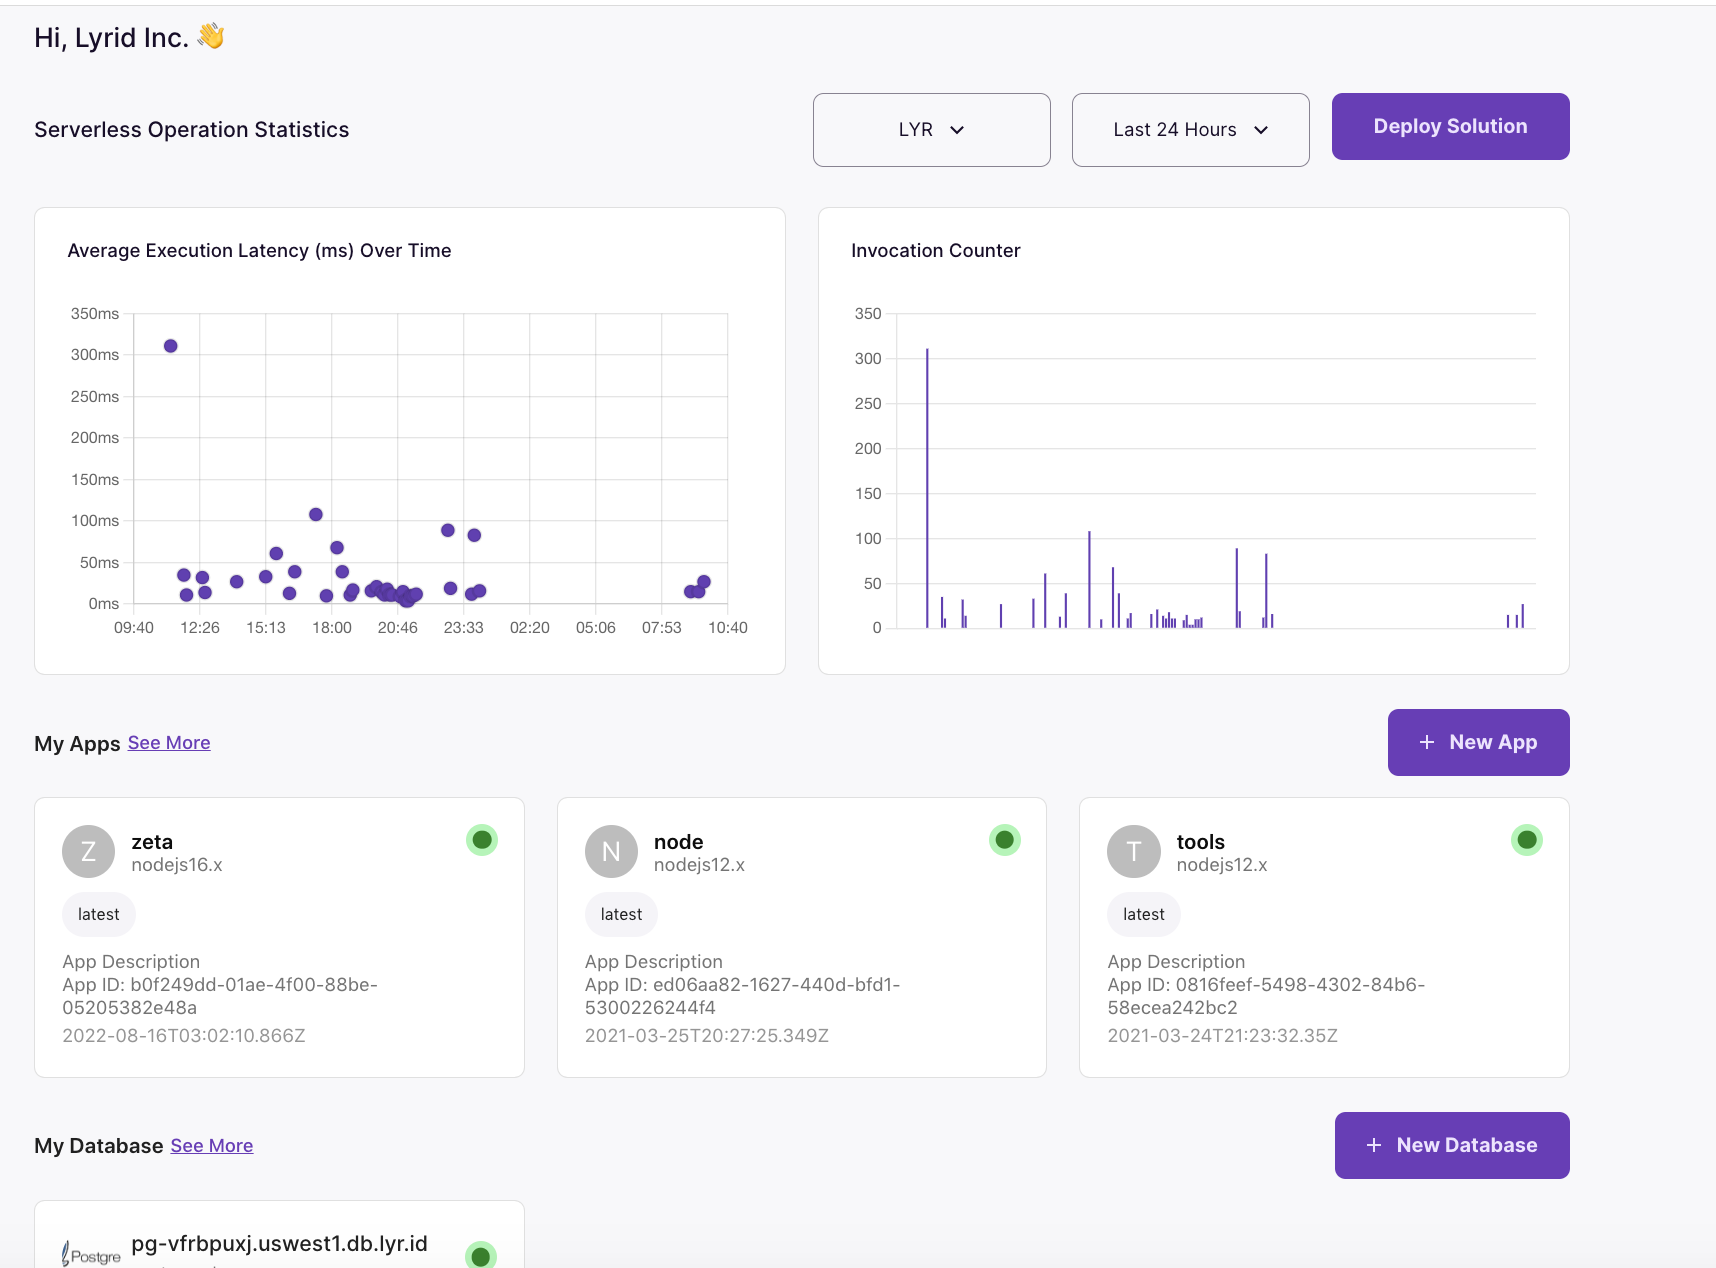
The Lyrid platform provides a user-friendly interface that allows anyone to deploy easily. Our dashboard provides users with a summary of all deployed applications and databases.
After registration, users will be redirected to the home dashboard, which is composed of three segments: operation statistic graphs, my apps and my databases. Your dashboard will be initially empty, it will update as users deploy on the platform! Dashboard contains several shortcuts that take users to start deploying applications or databases.
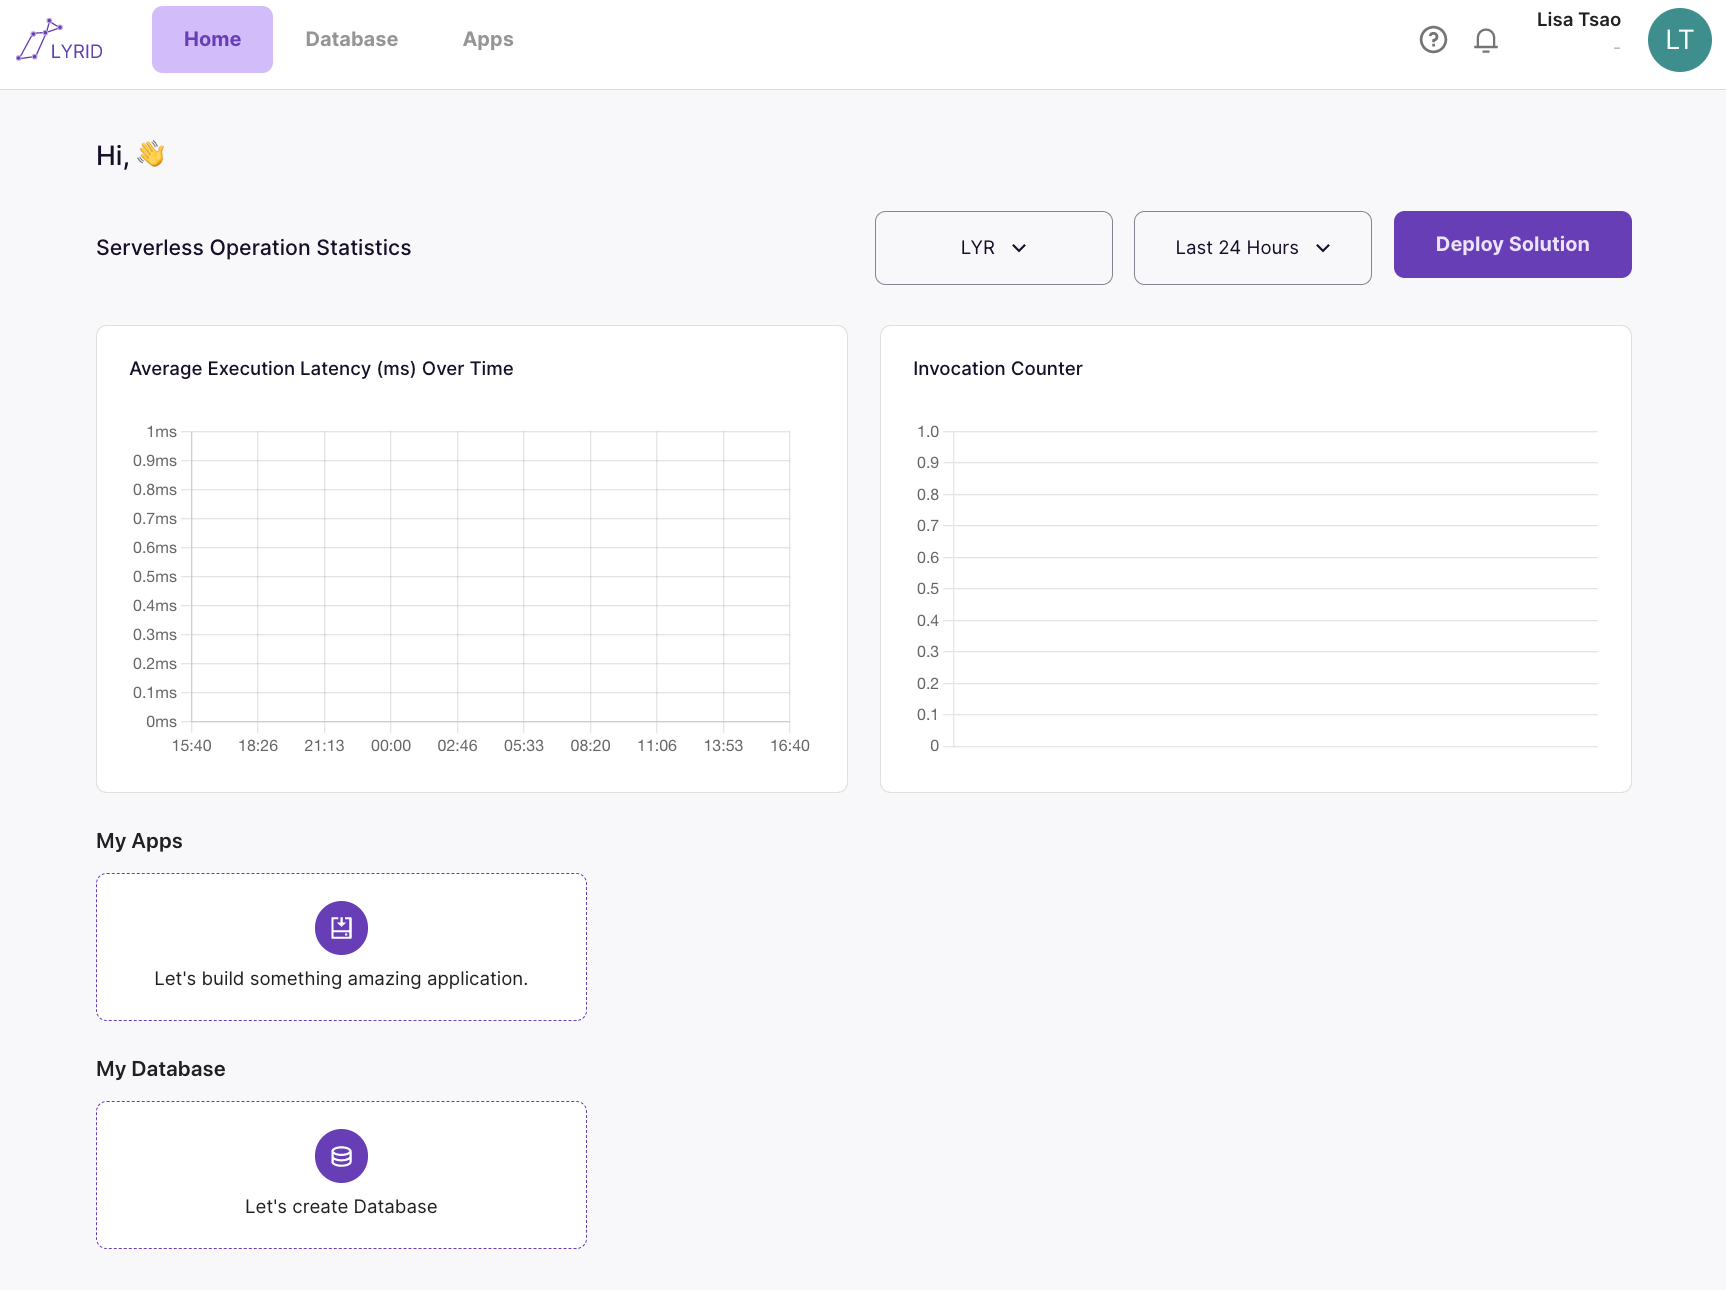
Dashboard Information
After users have deployed solutions on Lyrid, data will be updated dynamically and users could utilize the dashboard for better organization! Users could access all the databases and applications they have deployed using the dashboard.
If users have deployed on multiple cloud servers, users can check their application performance based on the server over a set period of time. The serverless operation statistics presents users with the invocation counter and the average execution latency.
Invocation counter - number of execution made on your application over a certain period of time Average Execution Latency - how fast or slow the application is running at a given time